We've recently migrated our price collecting bots to a new server and made some programming optimizations. As a result, daily prices are available by 5 am (MST) each day. That's five hours earlier than before and should be before the typical work day starts for most of the U.S.
The new bots also implement some different algorithms to increase the number of prices we are able to collect. That means that more games should have at least "2 sources" for their prices.
Monday, December 31, 2007
Faster, Better Prices
Sunday, December 23, 2007
Thank You for 2007, Here Comes 2008
I am away on vacation for the rest of the year so there won't be any more major updates to the blog until the first of the year. I wanted to take the time to thank you all for a great 2007 and the start of this new blog about video game prices. Thank you for reading the articles, adding great comments, and providing fantastic article ideas. Let us know what you have liked so far in 2007 and what you haven't liked too. Hopefully 2008 will be even better with more historic price analysis, pricing trends, and charts of the movers and shakers in the video game world.
At the beginning of the new year you can look forward to our "Video Game Price Report 2007" with:
- Ten Games with Biggest Price Increases in 2007
- Ten Games with Biggest Price Decreases in 2007
- Chart of Average Video Game Prices in 2007
- Chart of 2007 Prices for Games Released in 2006
- Summary of Biggest Stories Affecting Game Prices
- Predictions for Prices in 2008
Enjoy your Holidays. We will be back with more articles in 2008.
Wednesday, December 19, 2007
Super Mario Galaxy Isn't Enough For Me
This is what many gamers are saying after buying 1.1 million copies of Mario Galaxy in November. The price for Super Mario Sunshine for Gamecube increased more than 70% in November! Did the Mario love extend any further than Super Mario Sunshine. Let's find out.
The chart below shows Mario Sunshine's price during 2007.
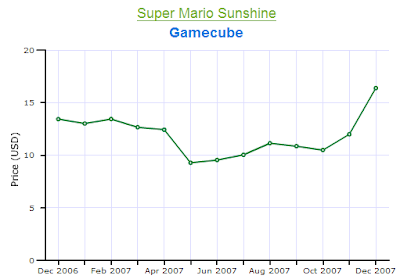
The chart shows the price rising from $10.50 to roughly $17 in November. Our daily updates show that the price has continued to rise to $18 as of 12/19/07 though this isn't reflected in the chart yet.
Mario Sunshine is the only other Super Mario platforming game that can be played on the Wii without using the virtual console. It makes sense that the price would increase so much. During the holidays prices increase in general for video games but on top of this parents are probably thinking 'Tommy likes Super Mario Galaxy maybe I should get him another game like it.' Does this logic extend to other Mario games on the Wii?
The charts below show prices for other notable Mario games for Wii and Gamecube (both playable on the Wii).


Unfortunately, we don't enough data to show an interesting chart for Super Paper Mario but you can check it out if you want to.
The charts show some interesting results. The only other Mario Wii game shows a very small price increase in December but a decrease in November. On the other hand the other two Gamecube Mario games showed price increases of more than 50% from October to December. I think the Wii price doesn't change as much because the game is still available at most retailers brand new, which keeps the price from increasing very much. But Gamecube games are hard to come by at most major retailers so many people have to resort to buying the games on eBay, Amazon, or other second hand locations. This forces those Gamecube game prices up while the Wii price stays the same.
These prices and other Mario game prices can be found at VideoGamePriceCharts.com.
Tuesday, December 18, 2007
Call of Duty 4 Doesn't Make People Want to Play Originals
Call of Duty 4 was released for Xbox 360, Playstation 3, and Nintendo DS this past month and the official sales numbers came in showing that CoD4 for 360 was the best selling game of the month. It sold 1.57 million copies in November on the Xbox 360. With 1.57 million people buying the 4th iteration in the Call of Duty series did many of them go out and buy the first three games? And did it affect the prices for those games?
The charts below show the historic prices of Call of Duty games on Xbox during 2007.
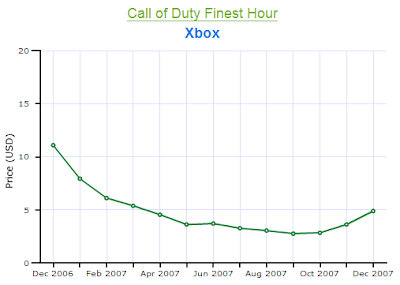


(Call of Duty 2 and Call of Duty 3 were released on Xbox 360 too but our site doesn't have enough price history to see any trend at this point).
None of the games show a large increase in price after Call of Duty 4's release in November. The original Call of Duty had an increase from about $3.00 to $5.00, but this is less than the average video game's price increase in November and December. The original Xbox Call of Duty games are on the backward compatibility list, so Xbox 360 owners can play them but there doesn't seem to be any increase in demand. This is in complete contrast with the original Halo games when Halo 3 was released. Those games spiked in price right before Halo 3 was released.
Video game price data provided by VideoGamePriceCharts.com. Wii Game Prices | Xbox 360 Game Prices | PS3 Game Prices
Friday, December 14, 2007
Will Wii Rainchecks Lower Prices Now?
Today Nintendo and Gamestop announced they would be selling rain checks on Wii Consoles on Dec. 20th and 21st. If you can't find a console now they will guarantee you get one in January. Will parents stop paying the high prices on eBay and Amazon for Wii systems now that they can guarantee delivery by January? Will this bring the prices down?
Prices on Wii consoles have already come down almost $100 from late November when they were selling for $590. But the prices haven't dropped since the rain check plan was announced. In fact prices on Wii consoles went up 2.1% yesterday (12/13/07) to $485.
I don't think this policy will change prices for Wii consoles very much and might not be very popular. I think most parents want to put something under the Christmas tree when they are giving presents. They don't want to put a piece of paper saying "You get a Wii in January sometime. Merry Christmas. From Santa".
I think Nintendo realizes that most people who buy for Christmas will find a substitute gift if they can't find a Wii this holiday season and might not try and buy another right away. They were looking for a gift, the gift has already been given so they don't need to buy a Wii anymore. Nintendo is just trying to stop this from happening by offering this rain check. A good business idea. But I don't think it will be that effective. People want the Wii for Christmas not a rain check and many people will be willing to pay extra online in order to have it.
Thursday, December 13, 2007
Mario Party Is A Popular Christmas Present
Mario Party games are very popular games overall and it is one of the franchises that Nintendo brings out annually like clockwork (or like Madden football to use a gaming simile). Unlike Madden games though, Mario Party's are actually popular long after they come out and almost every Mario Party game actually increases in price right before Christmas. Below are historic price charts for most of the Mario Party games.


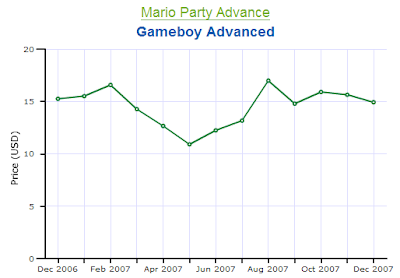
As you can see from the price charts, the prices of the Mario Party games follow a very consistant pattern. They drop in price the beginning of the year. The prices then hold steady for about nine months, only to rise sharply from November to December. This does follow the same general trend as all video game prices except that Mario Party games don't decrease throughout the year like other video games. Because of this the price spike in December brings the price of the games almost back to 2006 levels.
The only major exception to this trend is Mario Party Advance. It spiked in the summer and now prices have just held steady during the rest of the year. This is surprising to me because I would have thought Gameboy Advance games would be likely to increase in price at Christmas time because the owners are generally kids receiving presents.
Come Christmas morning when all you gamers wake up to see what Santa left you under the tree, don't be surprised if you find a Mario Party game. Hopefully he bought all of his back in October or he won't have money to buy what you really wanted.
Nintendo 64 Prices
Monday, December 10, 2007
Hunters Love Video Games
Every Fall across the US people start getting excited for hunting season. Hunters start practicing their calls to attract the animals. The Cabela's stores across the country fill up with people buying camouflage outfits and new shotguns. And State Wildlife Divisions start issuing hunting permits. Through all of this preparation for the new hunting season, hunters still find time to buy a bunch of video games. The prices for all the hunting video games shoot (pun intended) through the roof starting in August.
Cabela's Video Game Price Charts for 2007


In each of these historic price charts, the price of the game has decreased most of the year and then come August the price starts increasing only to accelerate in December. There are many more examples of this including Cabela's Deer Hunt 2005 for Xbox, Cabela Outdoor Adventure for Gamecube, and all the Big Game Hunter games.
Wikipedia says that hunters spent over $20.5 billion in their industry in 2001 and hunted for an average of 18 days. 18 days must not fulfill the hunting urge for most of these people because they seem to buy quite a few hunting games with this $20+ billion.
The price increases might also be due to wives buying the games for Christmas presents in hopes that their husbands won't leave on more hunting trips (I know women hunt too). This would explain the even bigger price increases right before Christmas time.
Whatever the reasons for the price increases. Hunters start paying about twice as much for their electronic hunting fix in December as they do in August. But its still a lot cheaper than a hunting license.
Wednesday, December 5, 2007
Britney Spears and Video Games
As you know we are a fairly new site and new sites are always looking for ways to get more traffic. After reading Yahoo's 2007 Top Searches report and seeing Britney Spears at number one, it dawned on me: We need an article about Britney Spears that is also video game related. Lucky for us Britney Spears came out with a video game called "Britney Spears Dance Beat".
While people are so busy searching for Britney Spears information are they also thinking, "I wish I could play a video game about Britney spears too instead of just reading gossip and seeing unflattering images." With the help of Google Trends and VideoGamePriceCharts.com data we can find out.
Britney Spears Dance Beat Price During 2007

Britney Spears Search Trend on Google

There were huge spikes in searches for Britney Spears in February and September related to her rehab visit and MTV embarrassment but there was no rise in the price for Britney Spears's video game.
Maybe its the horrible reviews the game received that stop people from buying it. A 4.1 average user review on Metacritic is not very good. I played it a bit myself once (I am kind of embarrassed to admit it) and it is a bad Dance Dance Revolution with lots of Britney Spears spread through the game.
Whatever the reason, people seem to be more enthralled with Britney in search engines and not quite as much on their Playstation 2.
PS. In case the rest of this article isn't enough to shoot us to number one on every search engine. Here is a random photo of Britney doing something funny. Yahoo number one here we come.

Tuesday, December 4, 2007
Browse by System
The most commonly requested feature so far has been people asking for a way to browse games by console. And now we've implemented it. The most popular systems (DS, PS2, PS3, Wii and Xbox 360) all have dedicated links in the left-hand navigation menu. To view the other systems, just click All Consoles in the menu and select from the resulting list.
On the All Consoles and system pages, you can click on the table headers to sort and filter. That should help you find the game you're interested in. As always, let us know how we've done.
Tuesday, November 27, 2007
A New Look
We've improved the look of VideoGamePriceCharts.com. The new page style should require no horizontal scrolling for those of you with smaller monitors. Now that that's done we're moving on to the next scheduled feature for the site: adding the ability to browse for games by console.
Make $150 by Not Playing Your Wii
If someone told you they would pay you $150 not to play your Wii for the whole month of December, would you take it? That is exactly what every Wii owner is being offered right now. Let me explain.
Wii prices are upwards of $590 on Amazon right now (probably even more by the time you read this, it increased $20 in the last five hours since I started this post).
After the 15% fee, I would have $501 in my pocket (even more if I sold it on ebay, thank you lower fees), but lets assume $500.
In January I buy a Wii back. In 2008, I could probably find the Wii in stores for $249 by waking up early on a Sunday and going to a Target or Best Buy. But even if I had to buy the Wii back on Amazon it would be a lot cheaper than it is now. The chart below shows that between August and October when the Wii was still hard to find, the average price on Amazon was $350.
Below is a chart of the prices from August 2007 until November 27, 2007.
So by selling my Wii now I would make $150 and all I give up is not being able to play my Wii for the rest of 2007. Think of it. Give up playing your Wii for a month and then you can buy Smash Bros Brawl, ten NES virtual console games, and still have $50 bucks left over.
You might even try and get lucky by waiting to sell you Wii until closer to Christmas. Lose less playing time and maybe get a higher price. With the Wii on the "Hot Dozen" list, Toys R Us list, and many hot toy lists for 2007 this might be a fairly safe bet.
Try the Video Game Pricing Service provided by VideoGamePriceCharts.com

Tuesday, November 20, 2007
Madden Prices Fall Fast on Playstation 2

Every every EA Sports releases their Madden football franchise to coincide with the new NFL season starting and every year it consistently sells millions of copies. The only thing more consistent is the price drop for the Madden games after their release. From the first day the game goes on sale, the prices start dropping every single month. Its very evident with the price chart for Madden 2008 above. The video game was released in August at $49.99 and by the end of the month was selling for $36, and for $29 by November. Will this price drop continue you ask?

Madden 2007 dropped in price every single month in 2007 except for a small increase in August when people wanted to get their football fix for cheap by buying Madden 07 instead of 08. This same pattern is seen with Madden 2006, and Madden 2005 to a lesser extent because it is almost worthless, selling for $0.39.
Madden football is very consistent in its sales every year, but also consistent in the fact that it will go on sale. Wait a couple of months or even until playoffs start and you can buy the game for half the original price and still enjoy the game in the height of the current football season.
Video game price data provided by VideoGamePriceCharts.com
Friday, November 16, 2007
Halo 3 Fans Get Nostalgic for the Original

Every gamer knows that Halo 3 was released for Xbox 360 on September 25 because it was almost a holiday in the gaming community. It sold 3.3 million copies in the September alone. A large number of these millions of buyers decided to prepare themselves for Halo 3's release by playing the original again. Prices for the original Halo went up almost 30% in September, going from $7.15 in August to $9.14 in September.
Plenty of gamers must have gone nostalgic after playing Halo 3 too, because the prices just kept on increasing in October. Going up another 10% during October to almost $10. But just as quickly as the price went up, gamers appetite for the original faded and the price dropped back down in November.
Moral of the story: If you going to relive your old gaming memories, buy it before everyone else does. You'll save a few bucks.
Video game price data provided by VideoGamePriceCharts.com
Thursday, November 15, 2007
Nintendo 64 Console Gets More Expensive

The Nintendo 64 Console has steadily increased in price throughout 2007. Its low for the year was around $9 in January and is now selling for $27.
The price increases have accelerated during the the past four months, increasing almost $2.00 every month. What is causing this sharp rise in prices? I don't think supply dried up, unless some warehouse stocked with Nintendo 64's caught fire that I didn't hear about. All the N64 consoles are owned by individuals hooked up to their TV's or packed away in boxes. Is there renewed interest in the Nintendo 64 because of the virtual console on Wii? Prices for Super Smash Bros, Mario Kart, and Super Mario 64 have started increasing during the past four months too. So maybe people are looking to play these games on the original system. But even they haven't increased as much as the N64 console's price..
Anyone have other theories why the Nintendo 64's price is rising almost as much as Nintendo's stock price?
Video game price data provided by VideoGamePriceCharts.com
Video Game Price Charts Are Live Again
VideoGamePriceCharts.com is back up again after being down last week. We have moved to a new server and everything is running smoothly for the last 24 hours. You should be able to see prices and charts for all the video games in our database. If you run into any problems please let us know.
On a side note. I will be trying to post a chart and a little bit of analysis every day for the next two weeks (not counting weekends and Thanksgiving though, sorry).
Saturday, November 10, 2007
VideoGamePriceCharts.com Up....and Then Down
Some of you might have noticed that we went live with VideoGamePriceCharts.com yesterday. Things started off smoothly with people finding prices for all sorts of video games and giving us their feedback on the beta version. And then it all came back down again. Due to heavy traffic on the server, things came to a stand still and then the server crashed.
For now we have put back the parking page we had before until we can work out the server issues and make sure this doesn't happen again.
Thanks everyone who did visit and thank you for your feedback too. We hope to have everything back up soon.
Blog Moves
People visiting the blog now might have noticed that the url has changed. We moved everything over to the new website blog.pricecharting.com to get ready for the new site launching.
We will be changing the look of the blog in the near future too. It will match the look of the new site but still keep all the same video game price analysis and charts.
Thursday, October 25, 2007
New Website Launching
Sorry the posts in this blog have been so far apart lately, but something good is coming from it. I have been busy working with a partner on getting all the historic video game pricing data I have online. Instead of writing posts about whatever I find interesting, you will be able to look up what you are interested in. The site will have prices on over 7,000 video games, accessories, and consoles for every major system from NES to Xbox 360, Wii to Super Nintendo.
The website is going to be called VideoGamePriceCharts.com. You can visit it now to get more info about what the site will show, see a sample graph, and bookmark it so you can come back later.
We plan on launching the site early November 2007.
You will be able to use the site to find the price for any video game today so you know how much to pay if you are buying it. Or how much to ask if you are selling it. You can see if the price on the game has increased or decreased over time. And the data will be updated daily so it is always as accurate as possible.
I will be continuing to blog about video game prices and different topics I find interesting but they might change a bit. I plan on writing more frequently about some graph that I think is particularly interesting and why. And then semi-regularly do the more in-depth analysis articles that this blog has now.
Please let me know what features you would like to see included in the new site so we can try to add them or consider them for future additions to the site.

Wednesday, September 26, 2007
More Video Game Publisher's Price Charts
People really seemed to enjoy the publisher's video game price charts I posted last week and I have had request for some more publishers. Here are eight more publishers and some quick comments about the charts and prices.
The big surprise in this chart is how strong Capcom's prices are during 2007. Their prices dropped almost the exact same at Atlus's, about 7 percent. Square Enix's video game prices were surprisingly weak during 2007. They publish mostly RPG's so the prices would be expected to stay higher throughout the year. Square's prices dropped about 28 percent compared to a 7 percent drop for all RPG's. Square is the largest of the RPG publishers so maybe they sell a lot more of their games than other RPG publishers do, lowering the resale value.
None of these publisher's prices show anything too surprising. They all drop at a fairly consistent rate throughout 2007. Ubisoft was down 31 percent, Sony 17 percent, Sega 25 percent, and THQ the biggest at 37 percent. THQ publishes lots of licensed video games, so it isn't very surprising their prices would drop the most. Sega and Ubisoft are in line with the average price decline of 30 percent for all video games this time of year.
I plan on posting again the end of this week with some more publisher's prices. Let me know which ones you are interested in so I can be sure to include them. Just comment below and I will be sure to see it.
Video game price data provided by VideoGamePriceCharts.com


Friday, September 21, 2007
Collecting 101: Publisher Can Determine Video Games Rarity
Readers asked me to write an article analyzing prices of games by publisher. Readers thought that certain publishers video games would keep their value longer than others. I have been on hiatus from blog posts for a while, but here are the full results of my video game price analysis by publisher.
I looked at prices for games published between 2000 and 2006 and averaged the prices for all games by a publisher during that time frame. I looked at over twenty of the largest publishers and Atlus because readers specifically asked me for that data. Then graphed the prices of all publishers indexed to 1.00 so we can see relative changes over the course of the year. The graph below only shows four publishers so the graph doesn't get too cluttered.
Of all the publishers in my dataset, Atlus kept the highest prices over the course of 2007 and EA had the biggest drop in prices. Atlus's games on average only dropped seven percent during 2007 while EA's games dropped 43 percent.
This huge price difference between the two publishers is because of their two vastly different publishing tactics. Atlus is a smaller publisher and focuses mostly on RPG's, which my last analysis showed have higher prices than other genres. Atlus's percentage drop of seven percent is almost the exact same as RPG's as a whole. Electronic Arts publishes lots of sports games, which drop in price more than any other genre. Also, a large percentage of EA's titles in during any year are yearly releases (all sports games) or almost yearly (Need for Speed or Medal of Honor).
One item to note with Atlus's prices. Because they are a smaller video game publisher they had few titles in anaylsis, making their data more volatile. The chart shows faster price drops and rises because of this. The best explanation I have for the large peak in August's prices is the release of Persona 3. One of my other posts showed that Pokemon prices increased after Diamond and Pearl came out and my guess is the same thing is happening with some Atlus games.
Microsoft and Nintendo data are in the graph too as comparison and because they are two larger publishers. Microsoft's video game prices dropped an average of 34 percent during 2007 and Nintendo's dropped 22 percent in the same time frame.
Nintendo published games seem to show a longer sales life compared to Microsoft games. I don't have solid numbers to back this up off at my finger tips, but looking at units sold per month Nintendo games seem to sell more longer after release instead of right up front like Microsoft published titles (Halo being the big exception to this). This might explain why Nintendo products keep their value longer, customers continue to look for them long after release.
Next time you plan on buying an Atlus game you can be pretty sure it will keep its resale value, but watch out for those EA games. They might be dropping faster than Pumpkin prices after Halloween. Homer Simpson had to learn the hard way, don't you make the same mistake.
PS: If there are any publishers you really want to see a chart for leave a comment and let me know. Since I have the data all calculated it should be pretty easy to get a graph together if you are interested in a certain publisher.
Video game price data provided by VideoGamePriceCharts.com

Friday, August 17, 2007
Collecting 101: Genre Is Big Factor in Video Game Resale Prices
The Genre of a video game is a major factor determining if a game's resale price will plummet, hold steady, or even increase. Sports games are notorious for losing their value very quickly after they come out and being almost worthless 4-5 years later. Which genre's have the best resale values and which have the worst?

This chart shows the average price per genre and how it changed during 2007. All genre's decreased in price, but RPG's and Fighting games had the smallest decline.
Sports, Racing, and First Person Shooters decreased the most, with an almost 35% decrease in nine months.
Even though the average game decreases, individual games within each genre do increase or hold steady. Below are charts show the distribution of price changes for each genre.


For Action, Sports, and Racing games the largest percentage of games decrease in price 50% or more. Almost a third of sports games decrease in price 50% or more.
Then there is a steady drop in the distribution until only 1.8% of games from all genres show a price increase of more than 50%.
RPG and Fighting games are different. Their peak distributions are closer to the middle of the range. 31% of RPG's actually increased in price, while 52% dropped. Only 16% of games in other genre's increased.
RPG's are two times more likely to increase in price
RPG's Compared to All Other Genres
Below is the table with actual distribution percentages for all genres.

All genre's have some games with price increases of 50 percent or more. And the percentage is roughly the same for all genres, between 1-3%. If you were to randomly buy a video game, it wouldn't matter what genre it was; you would have pretty much the same chance of hitting a home run and the price shooting up more than 50 percent.
The biggest difference is on the up side at the 10-20% ranges. 18% percent of RPG's increase between 10-20%, while all other genres have a 10% chances of increasing the same percentage.
How to Use Genre Information When Collecting Games
How can you use this data? If you decide to collect some video games you should probably focus on RPG's because they have the best chance of increasing in price, but be sure to choose selectively. Most RPG's still drop in price, you just have a better chance of not getting burnt.
Methodology: The charts show the number of games for each genre and how much they dropped in price from January 1st 2007 to August 16th 2007. Video game price data from PriceCharting.com.
Wednesday, August 8, 2007
Used Video Game Price Changes By Genre
Madden 08 and NCAA 08 are coming out in less than a month for about $50 a piece, but the prices will be dropping fast. Persona 3 on PS2 or Luminous Arc for DS on the other hand might not drop much in price at all. Sports games dropped an average of 35 percent in 2007 while RPG's only dropped seven percent. Below is a graph of the price changes for 2007 by genre.
A graph of only RPG's, Sports, and Action/Adventure games
As discussed in an earlier article, prices drop 25 percent on average by this time of year. So it is no surprise that every genre shows a fairly steady decline in price throughout 2007. Different genre's perform quite differently though. RPG's and Fighting games hold their prices the best throughout the year with only seven and sixteen percent drops respectively. Action and Adventure games are almost exactly the same as the average video game with a price drop of 25 percent during 2007. (This make sense action and adventure is the largest genre and weighs the overall average to behave similarly) Sports, First Person Shooters, and Racing games dropped in price the most during 2007 with decreases of 35, 32, and 33 percent respectively.
It is fairly obvious why sports games drop in price the most of any genre. New games are released annually and most people who play the games want the updated rosters and new features. The prices drop on older sports games faster than other genres because the new versions come out so often.
It is not quite as obvious why FPS and racing games would drop in price more than the other genre's and almost as much as sports. Maybe FPS and racer fans are similar to sports fans and they want the newest game available. They don't want Project Gotham 3 when they can buy Forza 2 or Gears of War when they can buy Halo 3 soon. The sheer number of units sold for these games weighs on the prices too. FPS and Racing games are two of the most popular genres so the new games sell lots of units; making used copies easier to find when the person moves onto the next game.
RPG's hold their value the best because many RPG's never sold very many new copies to begin with. Atlus is great example of this using limited production runs on many of their releases. Games like Persona, Ogre Battle, Disgaea, and other RPG's didn't sell very many copies initially and are hard to find now because of this. Other RPG developers are similar because RPG's are not as popular as other genres in the US. Another possible factor is RPG's generally take longer to play giving more 'value' for the money so people are willing to pay more for older games.
Fighting games are similar to RPG's production and sales wise which explains their higher prices. Fighters are more of a niche genre compared to Sports, Action, and Racing so not as many are produced. Fighter's might also keep their value longer because not as many titles are released so their isn't as much competition driving down prices.
Don't expect to get much money back when you go sell your Madden 2005 on ebay or at your local game store. But the RPG you found hidden away behind stacks of movie tie-ins and FPS could very well be worth the same as what you paid for it initially. And maybe more if you bought the next Earthbound, Suikoden II, or Digital Devil Saga.
Technical: The prices shown are seven day moving averages of the average price of games in a particular genre. The prices have also been indexed to all start at 1 in order to show relative price changes over time. Games used in this study were released between 2000 and 2006 for all major systems available during this time period. Genres without enough data points, at least 100 games, are not shown because one game could have too much sway on prices in smaller genres.
Video game price data provided by VideoGamePriceCharts.com
Friday, July 13, 2007
Playstation 2 vs Gamecube vs Xbox - Used Game Prices
Fanboys love to debate the merits of their favorite systems. Everything from graphics, online play, total sales, third-party game selection, and overall game selection are argued about. I’m adding another coal to the fire: Which games keep their value better? PS2, Gamecube, or Xbox?
Below is a table of the average release price and today’s price for each system.
| System | # of Games | Avg. Release Price | Avg. Used Price | % of Original Price |
|---|---|---|---|---|
| PS2 | 855 | $41.21 | $9.23 | 22.4% |
| Gamecube | 455 | $41.71 | $10.72 | 25.7% |
| Xbox | 565 | $41.29 | $5.83 | 14.1% |
The average release price is pretty much the exact same for each system, but the average used game price today is much different. Gamecube games have kept 26 percent of their value, slightly ahead of the Playstation 2 at 22 percent. The Xbox is substantially lower at 14 percent.
I don’t know for sure why these differences exist, but I imagine the Xbox prices are lower partially because bootlegging games on the system is easier (and more popular) on the Xbox than the PS2 or Cube. If a person can copy their friend’s games to their modded system they have no need to pay for the used games.
Below is a graph of the average prices for each system’s games on a daily basis through 2007.

Playstation 2 prices have stayed much higher in the past seven months than the other two systems. PS2 games lost about 17 percent of their value from Jan 1 to July 13, while Gamecube and Xbox games both lost about 30 percent.
This is because the Playstation 2 is still alive and ticking and hasn’t been completely kicked to the curb by Sony, like Nintendo and Microsoft did with their systems. The buyers of those nearly 200,000 PS2's that sold last month have to buy something to play on it. And some of them inevitably buy used games, keeping the prices quite a bit higher.
For now, the Gamecube fanboys can rejoice. The Cube reigns supreme as the system with the games that keep their value the best. But I think the trends in the graph will continue and PS2 prices will eventually pass the Cube's and PS2 fanboys will have the last laugh. Sorry Xbots, your system doesn’t win this round.
(Side Note: I only used games released before 2007 for this analysis so the PS2 doesn't get any unfair advantage by having more newer games in the data)
Video game price data provided by VideoGamePriceCharts.com
Saturday, July 7, 2007
What You Would Like to See
I have been doing this blog for three months now and have lots of ideas for pricing analysis and what I think would be interesting. But some of the best ideas I have received have been from my readers and their emails, comments, or other discussions. I decided I would make an official post asking for input about what my readers want to see and read about. Post a comment with your ideas for something you want to see analyzed and I will add it to my list and sift through the data and maybe make a post about it.
Here are some ideas readers have given me so far:
- Price comparisons on different systems. Do prices drop faster on a particular system?
- Price comparisons by Publisher. Do certain publishers make games that keep their value longer?
- Compare the Game Index to Google Trends data. Do prices increase when searches increase?
- Are there any games that increase in value? Is there a trend on which ones they are? And can you predict it?
If you ever come up with a good idea, simply come back to this post and send a comment. I will come back on a regular basis to check on the ideas. And update this list with new readers ideas to spark some more creative juices. Thanks for reading and for your suggestions.
Friday, July 6, 2007
Video Game Prices Drop 60% in First Eight Months
I tracked the prices of video games released in October and November of 2006, 2004, 2002, and 2000 to see how their prices behave after a game has been on the market eight months, two years, four years, and six years. The average game released in 2006 dropped 60% between it's release and July 1st. The games released in 2004, 2002, and 2000 had dropped an average of 20% in this same time period.
The graph below shows the relative price changes from February 1st to July 1st on a daily basis for each release year.
Video games are obviously a depreciating asset. Every single year they drop in price over time. Like cars, computers, and most other equipment, the prices drop the fastest the first year. Games released in 2006 depreciated an average of 32% from their release date until February 1st, going from $42.08 to $28.66 in three months (not shown on graph). And then drop another 38% in the following five months from February until July 1st, going from $28.66 down to $17.70. The average video game released in 2004, 2002, and 2000 only dropped 20% during this same time frame going from an average of $9.61 to $7.70.
By the second, fourth, and sixth year after a video game's release, the prices follow almost the exact same pattern in their price depreciation. This also is very close to the Overall Video Game Index as you can see in the graph below.
This information won't stop me from buying the Halo 3's, Mario Galaxy's, and Metal Gear 4's of the world, because they are worth every penny and I don't want to wait six months. But for all those marginal games that I might like but can't quite decide if I want to buy them, I'll wait a few months and save myself some money. If I wait six months, I can buy two games for the price of one.
Downloadable Video Game Price Guide available


Thursday, June 21, 2007
Pokemon DS Games Raise All Pokemon Prices
Pokemon Diamond and Pearl were released April 22nd for the Nintendo DS and prices for all the older Pokemon portable games shot through the roof in anticipation. Apparently, the slogan “gotta catch’em all” refers to the games as well as pokemon themselves.
The graph above shows the average price of all portable pokemon games on a seven day moving average vs. the price for all video games during that same time. The data starts in early February, almost three months before the DS games were released, and goes until the end of June 2007.
The blue section shows the prices stay relatively even with the overall video game index initially. From the end of February until Pokemon Diamond and Pearl were released on April 22nd (the yellow section) prices start rising and don’t follow the same trends as the rest of video game prices. For the next month after the release prices fall back into the overall trend and steadily decline at roughly the same pace as the index prices. Starting in the green section though, prices for Pokemon games start increasing again and are nearly 50 percent higher than other video games at that point and 23 percent higher than when they started back in February.
What accounts for these big differences in prices and the three separate price increases? Generally, people want to collect all 493 pokemon, which requires them to buy the older games as well as the new one. Or, they enjoy the new ones so much they want to play the older games, too. Whatever the reason, people seem to really increase their buying at three separate times shown on the graph below.
The first increase is about two months before the new DS games release and prices increase about 20 percent in 30 days. The second increase is shorter and not as big, about 11 percent in two weeks. The third price spike starts the day kids get out of school for the summer, May 25, the Friday before Memorial Day. Parents start buying games for their kids once they are out of school and have more time to play. What better way to entertain your kids all summer than a collection quest that requires you to beat at least three different games?
The time between the three price spikes are generally decreasing about the same as the overall video game market. Showing that supply and demand for pokemon games and all video game are about the same during these time periods.
I plan to continue looking at pricing trends for other old games after the new ones come out to see if this same phenomenon occurs. Does it happen to Spiderman 1 and 2 when the third game came out? What about Final Fantasy X and X-2 when Final Fantasy XII came out? I’m guessing all games show a spike to some degree when a new one in the series arrives, but by how much? Back to the data I go to find out.
Try the Subscription Video Game Pricing Service


Tuesday, June 5, 2007
Buy Video Games in November
If you want to save money on your video game purchases, buy used games the first week of November when the prices are the lowest they will be the entire year.
Before I get into any analysis, I want to go over what this graph represents. I randomly chose 50 used video games for PS2, Gamecube, Xbox, and Gameboy Advanced and tracked their prices on a daily basis for the past 18 months. Each price point on the graph represents the average of all 50 games on that particular day. The graph was indexed so January 2nd 2006 is defined as 100% and every other day is a percent of that value. For example, November 4th is 60.3% of the January 2nd price and also happens to be the lowest point of the year. (If you want to know how I get the prices for each of the 50 games read my "How do I get the Prices" post)
The prices throughout the year seem to break up into four distinct groups better illustrated below.
The blue segment is January through the end of May and prices are decreasing for the most part. Yellow is the summer months, June through the end of August and prices are fairly steady during this time period. Then there is a drop in September and October represented by the pink region. And finally a sharp rise in prices starting in November and ending at the end of December shown in green.
I think some major events are responsible for the general trends. Christmas is obviously responsible for the big upswing in the green region. Video game prices increase more than 30% from their November lows to the December peak and this makes sense because everyone and their mother (literally) are buying video games for gifts. The prices in the blue region are the inevitable decline in prices after the Christmas rush is over, but why is there a distinct leveling out of prices starting in June? From my experience and from what the data shows, I think people start buying games again once kids are out of school. I know, I know, they should be playing outside on their bikes, but the prices stop declining right after Memorial Day and stay steady up until Labor Day. I think video games are used as a cheap way to entertain the kids while they are home during the summer. After Labor Day the pink region starts and prices decline again until November when Christmas shopping takes over.
So what can you do with the data? If you get a bunch of games for Christmas that you decide you don't want or you beat in two days and you decide to sell them online. Be sure to sell them as quickly as possible because they depreciate pretty fast. Or if you are looking to buy some used video games as gifts for Christmas or Hanukah, buy them in November. Procrastination will cost you quite a bit of money.
Just as you compare an individual stock's return vs. the SP 500 to know how it behaved relative to the market; I will be using this baseline seasonality graph in all my future posts. Individual games prices will be compared against the overall used game market to see how they compare. I will start using it in my next blog post about Pokemon game prices before and after Pokemon Diamond and Pearl released for DS this past April.
Video Game Price Service Available for Retailers


Wednesday, May 9, 2007
How Are Video Game Prices Determined?
This blog will contain lots of data about prices and you might wonder how do I actually get the data and can it be trusted as accurate. The prices are based upon a propriatery equation I have developed that takes into account actual prices gathered from Amazon, Half, Ebay, and JJGames. I can’t tell you the exact equation because it is a trade secret, but I use it at www.jjgames.com to determine our prices so I definitely believe it to be THE price.
I have daily prices for thousands of games using this equation, but most of the blog posts and graphs will use 7-day averages instead of the daily prices. I do this because daily prices for video game are really volatile and a 7-day moving average gives a better indication of where the prices are going. Below is an example for daily prices vs the 7-day moving average for Super Mario 64.

When I show charts in future blog posts, the price will be the 7-day moving average NOT the daily price. I think this helps a lot with comparisons between different video games and allows easier discussion on trends, which is what this blog is all about.
Friday, May 4, 2007
Welcome to Used Video Game Pricing Blog!
I’m excited to start this blog about used video game prices, but first I wanted to let you know what to expect from the blog.
The blog will be about the pricing for used video games and how the prices change; when they change the most; and what certain events do to game prices. Examples of questions I will answer are: What happens to video game prices at different times of year? What happened to prices of old Pokemon games when Pokemon Diamond and Pearl came out for DS? And can collecting video games actually make you money? I plan on showing you graphs and reliable pricing data at the heart of all my posts. But most of the posts won’t be too technical.
Why should you read a blog that I am writing about video game pricing? I own a business selling used video games: www.jjgames.com. As part of this business, I have collected price data on thousands of video games for the last six years, which makes as close to an expert on this topic as you can get.
The first couple of posts will be introductions about how I get the pricing data and a bit more about myself, but then I will dive right into the first real post; how prices change on games through out the year? When do the prices go up? When do they go down? And by how much?
Subscribe to:
Posts
(
Atom
)

